People photograph, type or say what they eat in Kaloria, in 40 languages. We counted what ended up on their plates: how big a meal is, how much of it is protein, when dinner happens and what changes at the weekend.
602,863anonymous food logs
179,686photographed meals
24languages with enough data
2026-01 – 2026-10period
Key findings
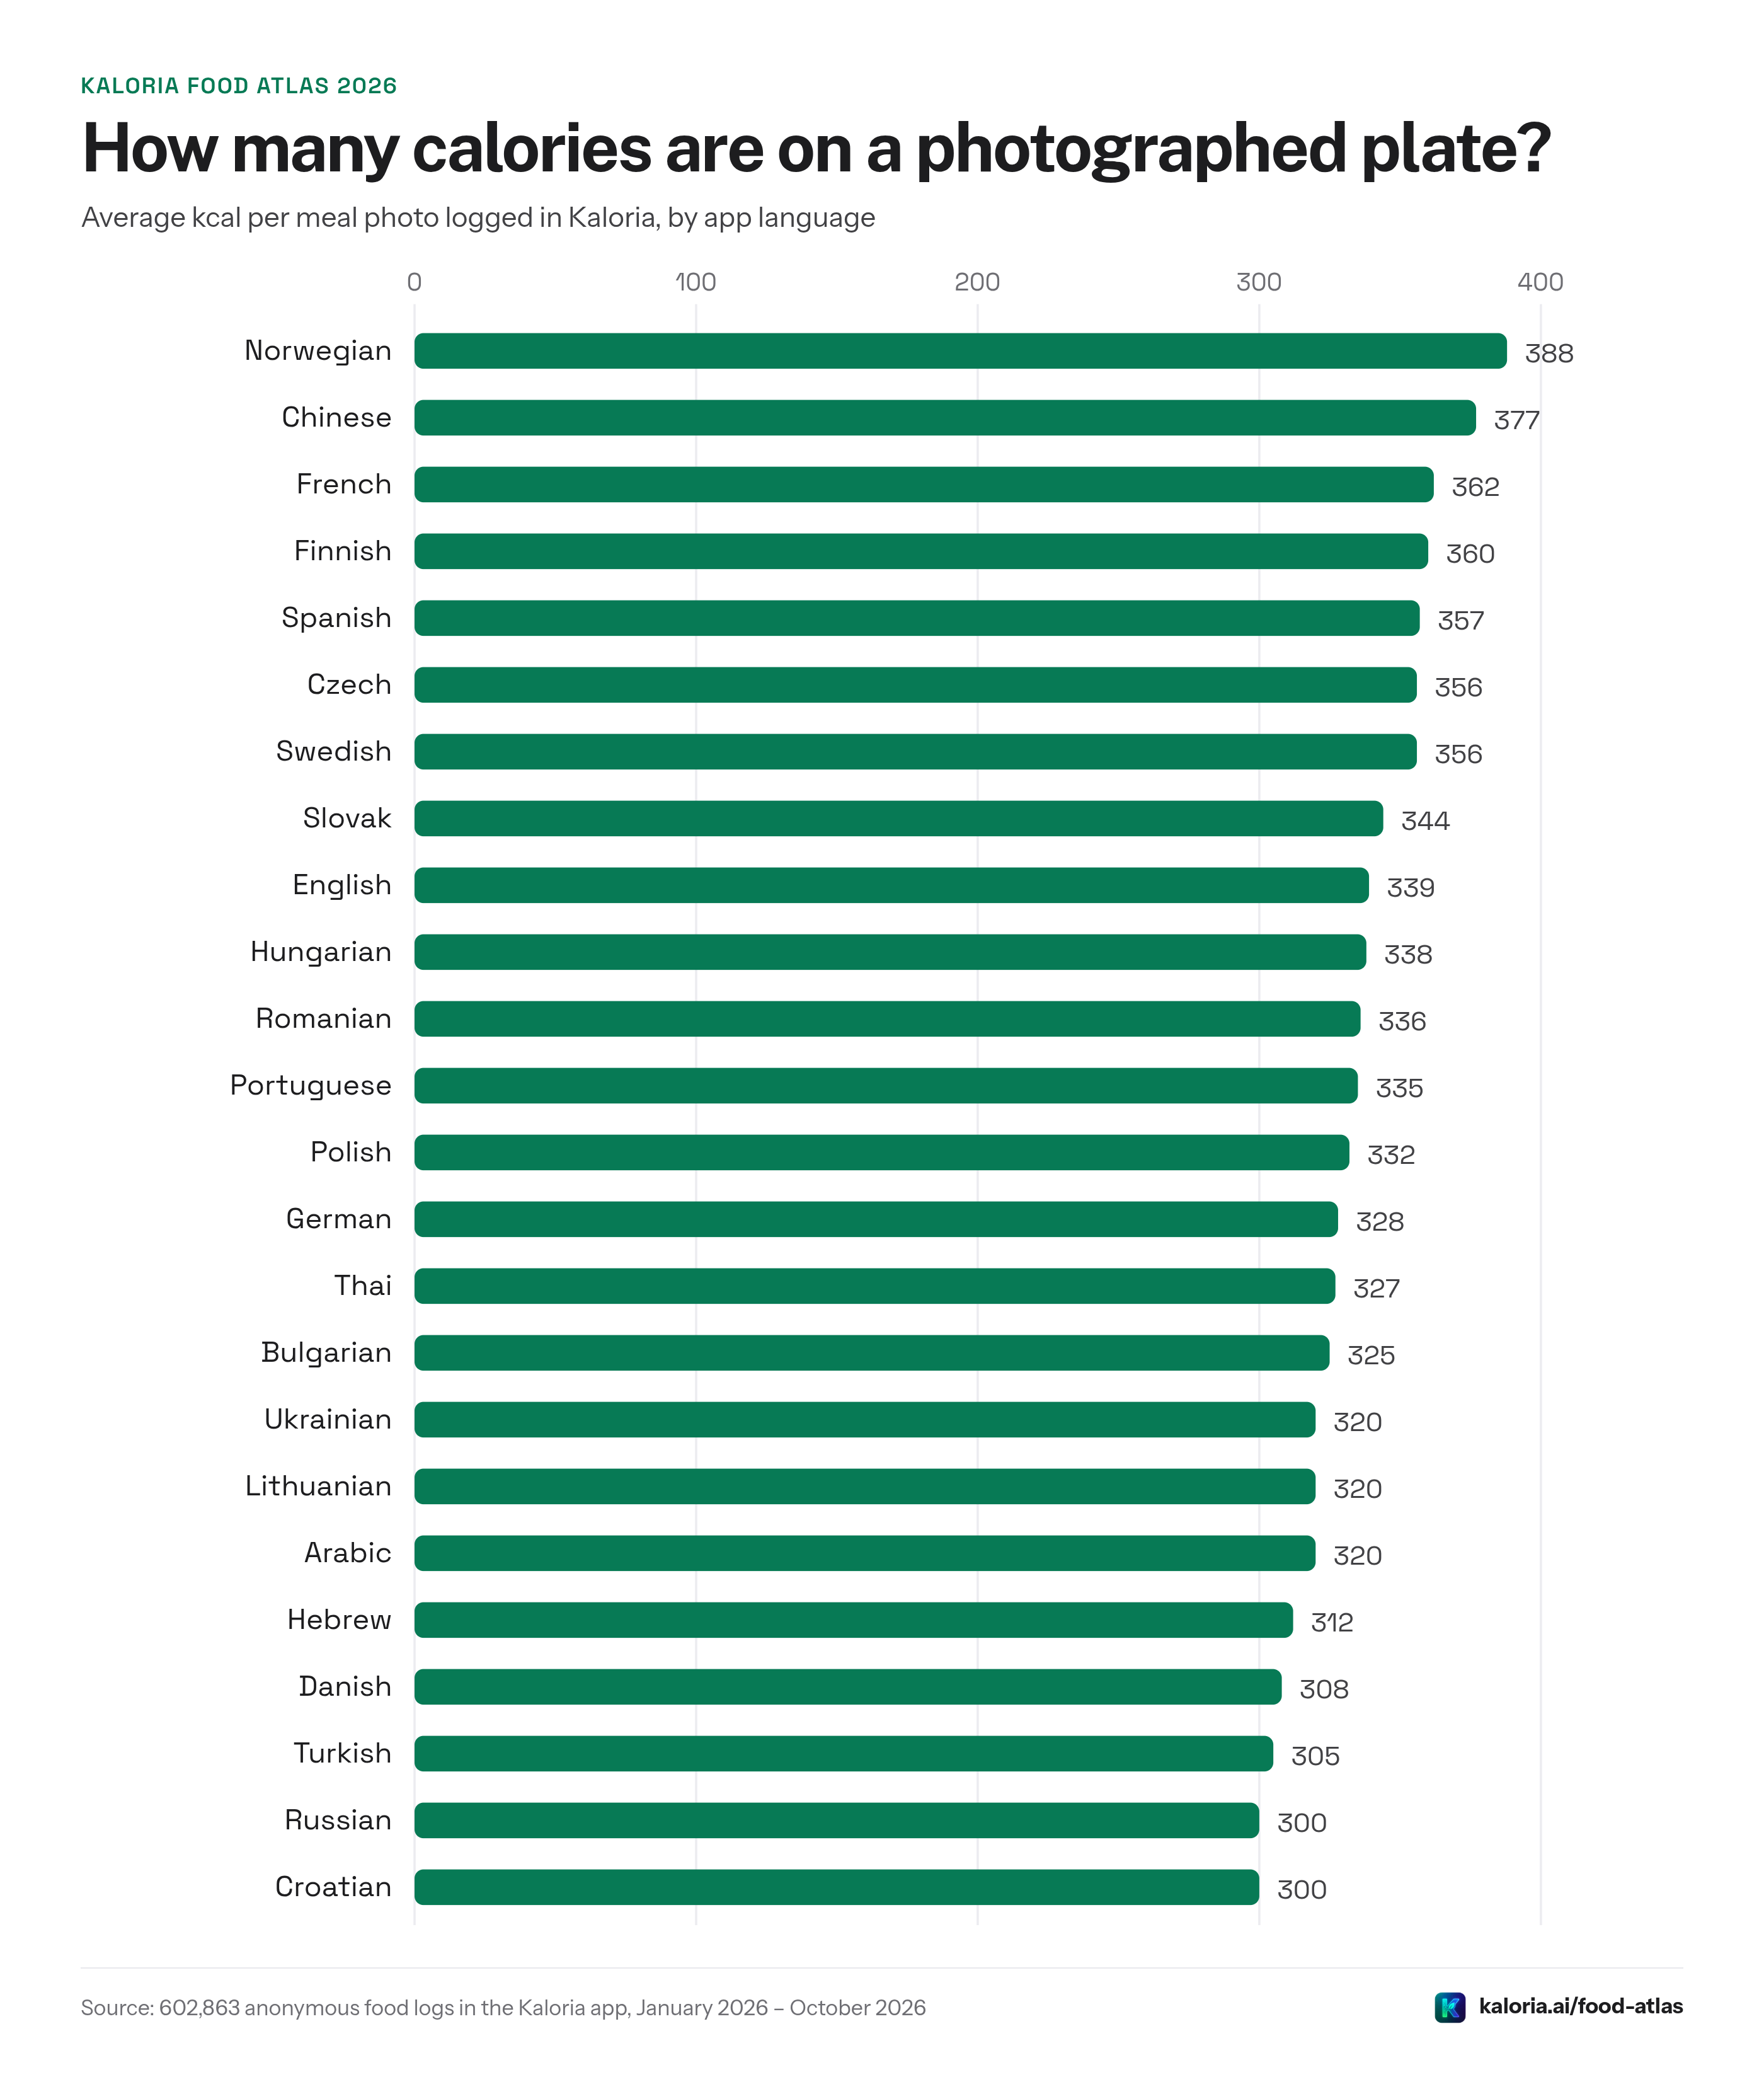
Norwegian-language plates are the biggest: 388 kcal per photographed meal on average, against 300 kcal for Croatian.
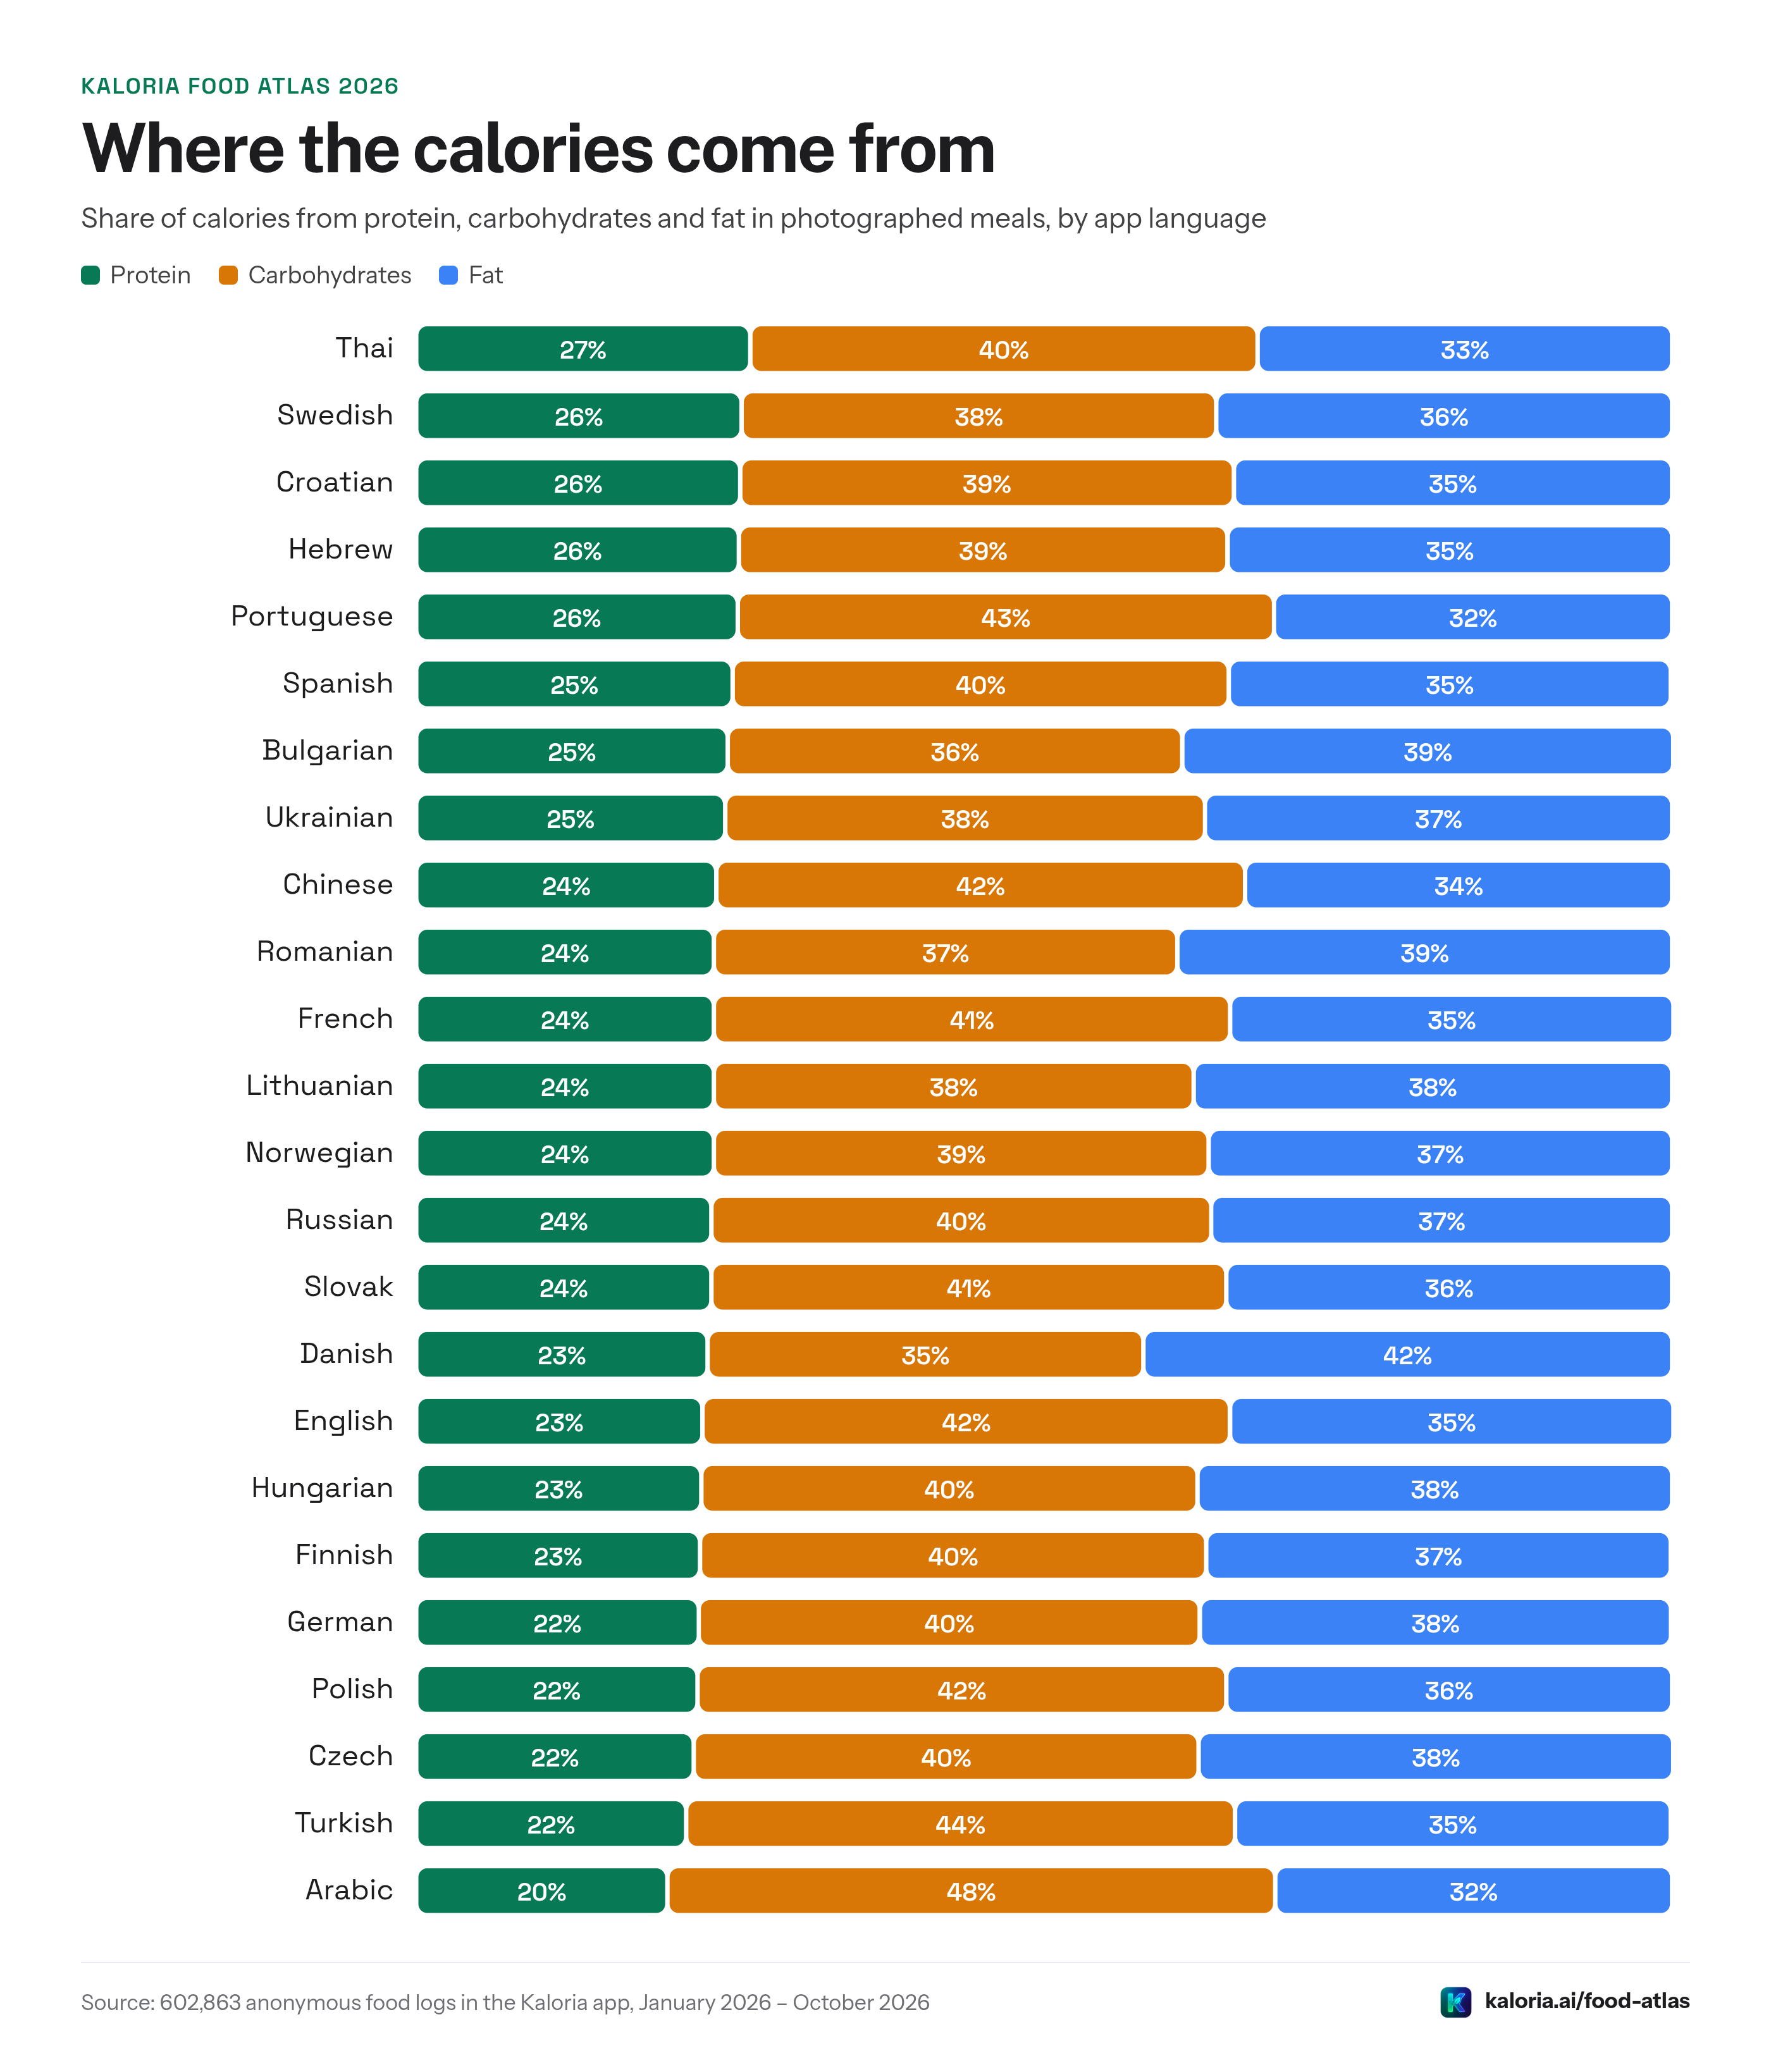
Protein: Thai logs get 27 % of their calories from protein, Arabic logs 20 %.
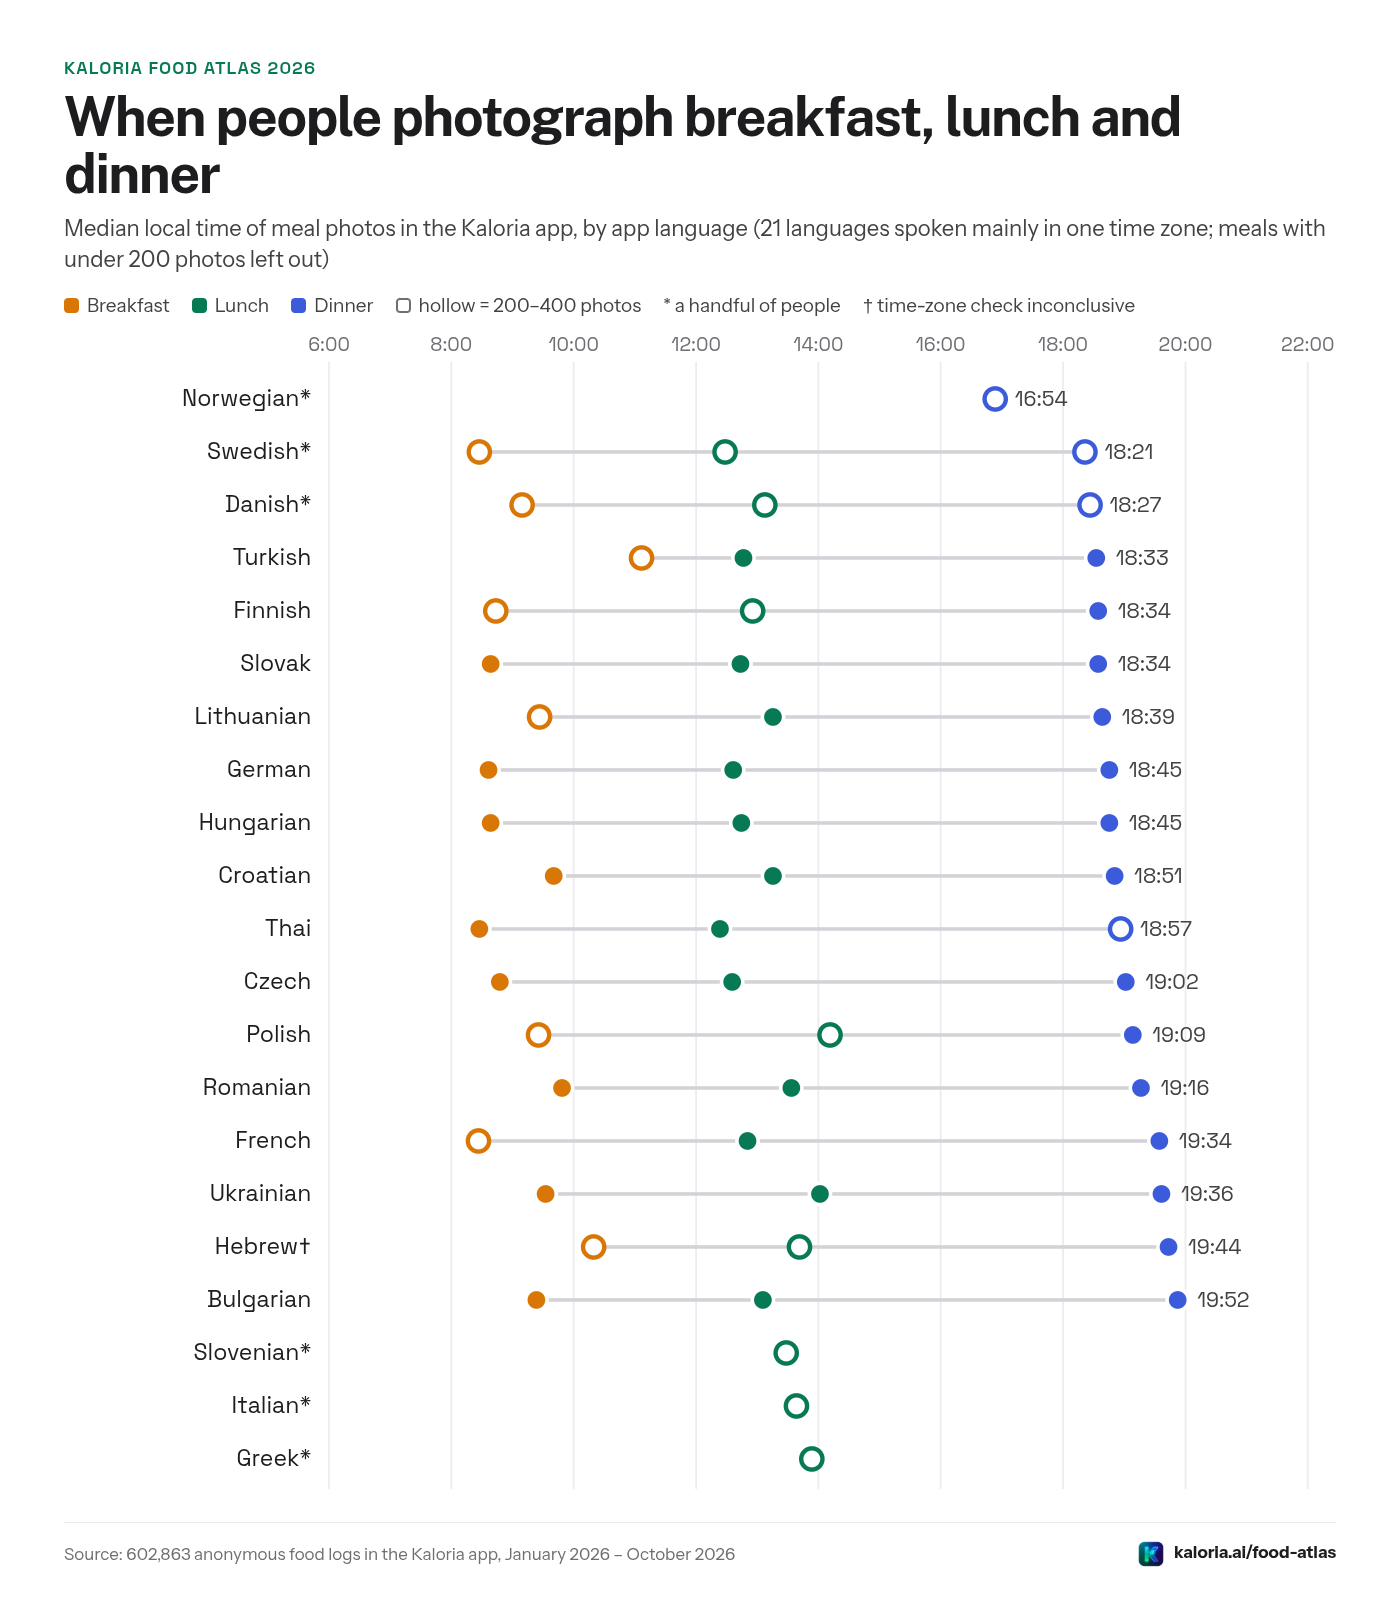
Dinner time: photographed dinners range from 16:54 in Norwegian-language logs to 19:52 in Bulgarian ones. Dinner times in the app match Eurostat's time-use surveys to a median of 20 minutes (15 countries).
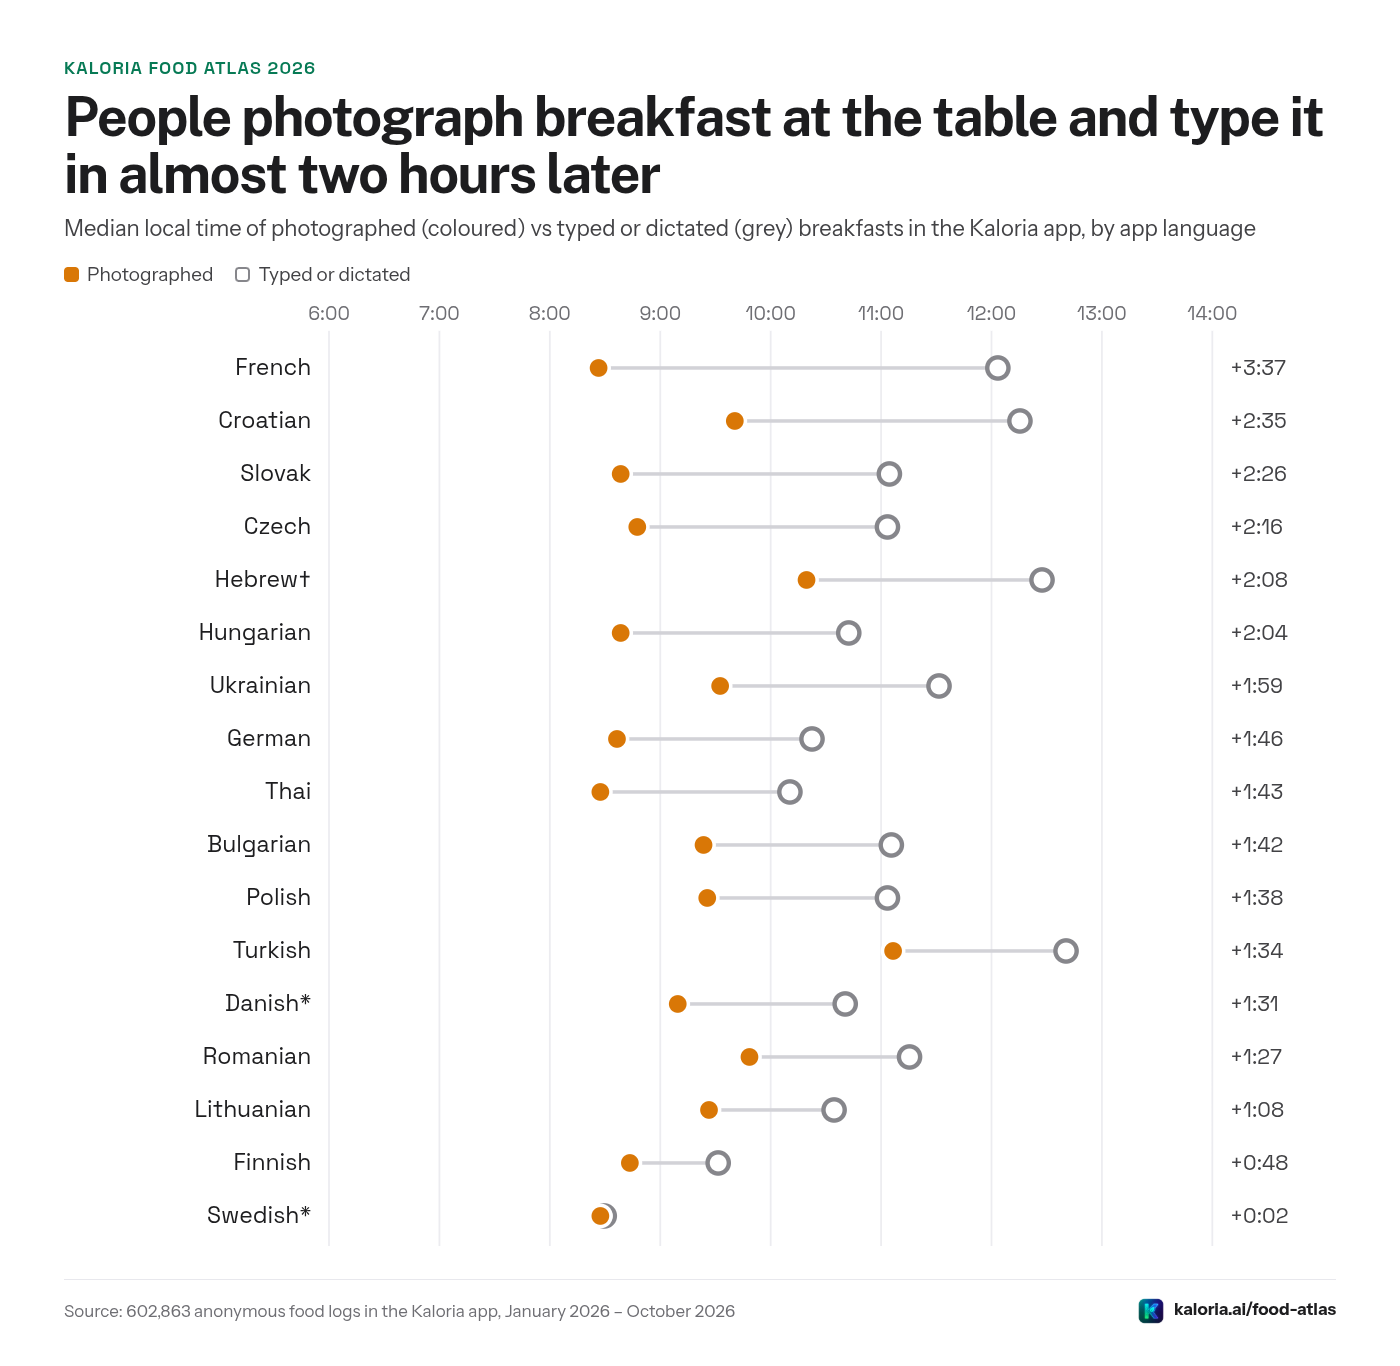
Breakfast is typed in late: photographed breakfasts are logged at about 8:39 in Hungarian, typed ones at 10:42. Across 17 languages the median gap is 1 h 43 min: people photograph breakfast at the table and type it in later.
Weekends: plates get bigger at the weekend in 19 of 23 languages; the jump is largest in Romanian logs (+7 %).
Eggs beat bananas, milky coffee and protein shakes in 19 of 24 languages, from 5 % of all logs to 19 %. Protein products win in Slovak, Hebrew, German, Croatian and Danish logs.
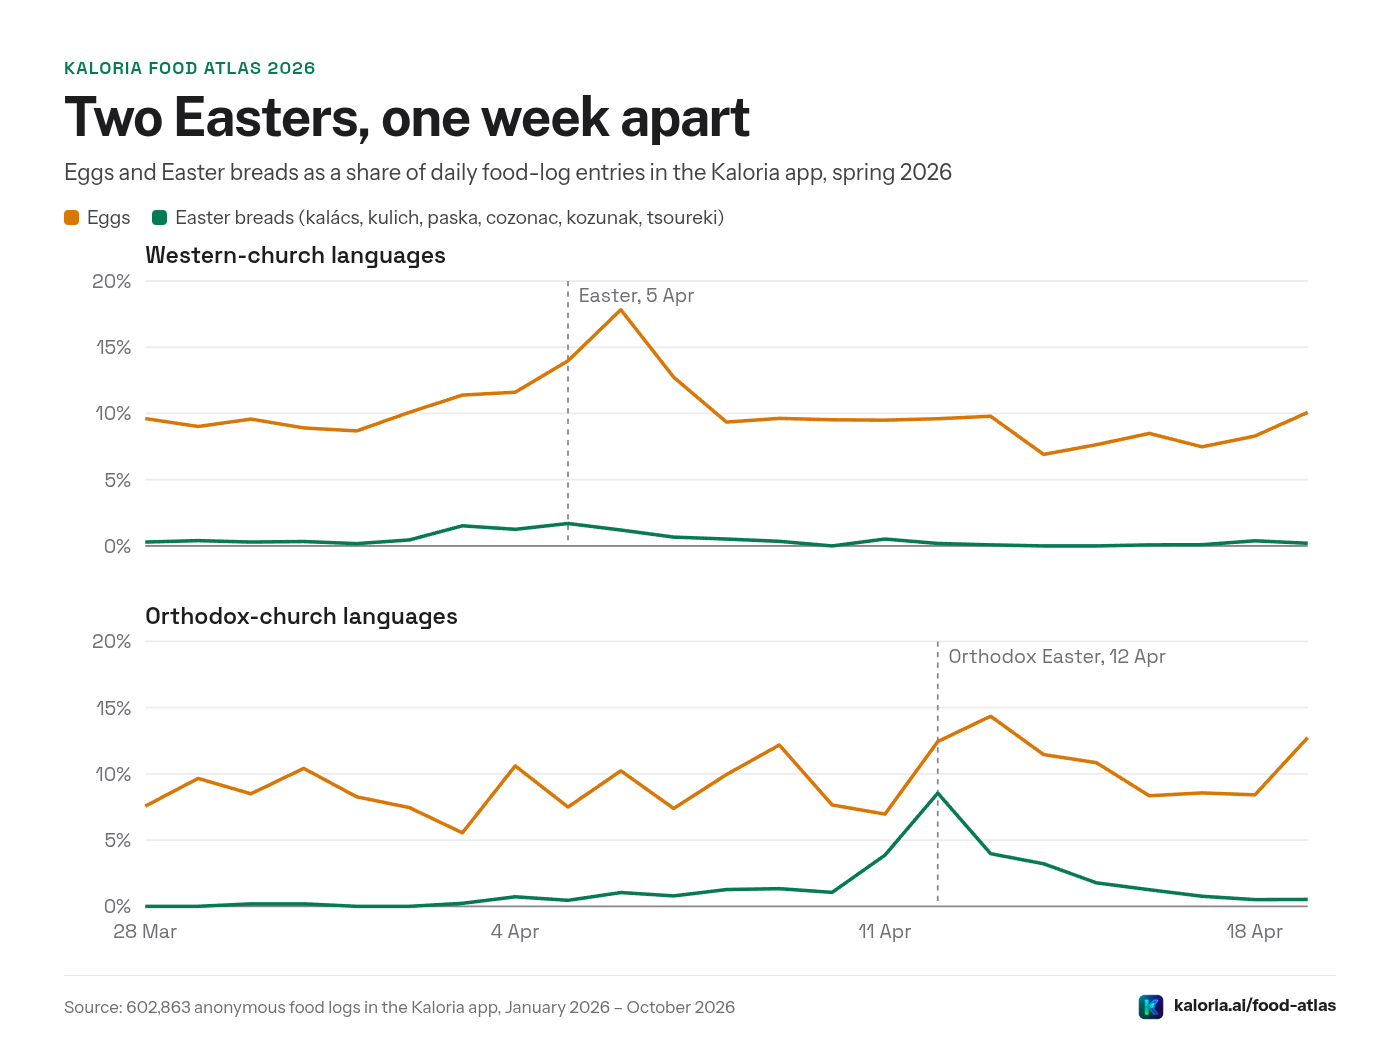
Two Easters: eggs doubled in Western-church languages on 6 Apr; Easter breads jumped about 70-fold in Orthodox-church languages a week later.
Passover: bread fell to 6.4 % of Hebrew-language entries during Pesach and jumped to 18.1 % in the three days after.
How big is a plate?
Average calories in one photographed meal, by the language of the app. A photo usually shows one plate or one snack; a full day is several photos.
kcal per photographed meal (mean). Languages with at least 1,000 photographed meals.
What the calories are made of
Share of calories from protein, carbohydrates and fat in photographed meals (protein and carbohydrates 4 kcal per gram, fat 9 kcal per gram), sorted by protein.
Protein
Carbohydrates
Fat
% of calories, photographed meals.
When breakfast, lunch and dinner happen
Median local time of photographed meals, for languages spoken mainly in one time zone. A photo is taken with the plate in front of you, so it is the closest thing to the moment people eat. Typed entries are left out of this chart: they are often added hours later (see below).
Breakfast
Lunch
Dinner (time labelled)
hollow = indicative
Median local time of meal photos, sorted by dinner. Filled dots rest on at least 400 photos and a narrow 95 % interval; hollow dots on 200–400 photos or a wider interval; meals with fewer than 200 photos are left out (no Dutch meal reaches that). * Fewer than 25 entries a day: a handful of people. † The time-zone check was inconclusive for Hebrew (see the method).
How close is this to reality? We compared the times with Eurostat's harmonised time-use surveys, which record what share of people are eating in every 10-minute slot. Dinner times in the app sit a median 20 minutes from each country's dinner peak (15 countries; rank correlation 0.92 without Türkiye, where app users log dinner much earlier than the survey shows). Photographed lunches sit a median 15 minutes from the lunch peak (13 countries, rank correlation 0.88). Breakfast is close in minutes (median 39) but does not rank countries reliably. Norway's early dinner is in the official data too: a peak at 16:40 against Sweden's 18:20 (Martín-Olalla, Scientific Reports 2018). Sources: Eurostat HETUS.
Breakfast gets typed in almost two hours late
People photograph breakfast at the table but type it in later, often from work. Median local time of photographed breakfasts (coloured) against typed or dictated ones (grey), with the gap on the right.
Languages with at least 200 photographed and 200 typed breakfasts, sorted by the gap. * Fewer than 25 entries a day. † Time-zone check inconclusive.
The weekend effect
How much bigger (or smaller) a photographed meal is at the weekend than on a weekday.
Change in mean kcal per photographed meal, weekend vs weekday.
Eggs, bananas and protein shakes
Share of all logs that mention a food, in every language's own words (for example tojás, яйца, ביצה and huevo all count as eggs). Eggs lead in 19 of 24 languages and peak in Portuguese logs (19 %). Protein products are biggest in Danish logs (12 %).
Language
Banana
Coffee with milk
Eggs
Protein shakes, bars, powders
Portuguese
6.0
6.4
19.2
3.2
Turkish
1.8
0.9
17.9
1.9
Thai
2.9
–
17.6
1.9
Arabic
3.1
1.2
16.8
–
Spanish
4.9
2.3
16.4
2.4
Romanian
4.6
3.3
13.8
0.9
French
3.5
2.0
13.2
1.4
English
3.5
2.0
11.8
7.9
Swedish
6.9
1.0
11.4
5.2
Ukrainian
3.0
1.7
10.1
3.9
Lithuanian
3.7
1.8
9.6
6.2
Polish
3.3
2.9
9.5
5.8
Norwegian
3.1
2.3
9.4
6.8
Chinese
1.2
–
8.8
0.5
Danish
3.5
2.0
8.8
11.7
Bulgarian
3.7
1.3
8.5
5.6
Czech
3.5
1.2
8.0
5.5
Hungarian
2.4
2.1
7.9
2.0
Hebrew
2.0
2.2
7.7
7.8
Finnish
3.8
1.1
7.6
7.5
Russian
2.3
1.9
7.0
3.4
Slovak
3.7
1.3
6.2
8.2
German
2.0
2.8
5.6
8.7
Croatian
4.0
1.4
5.0
7.8
% of logs. Sorted by eggs. "–" = fewer than 40 matching logs.
Two Easters, one week apart
Western Easter fell on 5 Apr 2026 and Orthodox Easter on 12 Apr. In Western-church languages, eggs went from 8 % of all entries to 18 % on 6 Apr. In Orthodox-church languages, Easter breads went from 0.1 % to 8.6 % on 12 Apr, a week later. Neither group reacted to the other's date.
Share of all entries per day. Western-church languages: Hungarian 48 %, Czech 10 %, Spanish 8 % of entries, plus Croatian, German, Polish, Lithuanian, Dutch, French, Italian and Slovenian. Orthodox-church languages: Russian 52 %, Ukrainian 14 %, Bulgarian 12 %, plus Romanian, Serbian and Greek. Baseline: 1–24 March and 23 April – 10 May.
The quark belt
Quark, curd, skyr and cottage cheese (tvaroh, túró, twaróg, творог, varškė, kvarg, skyr) run through Nordic, Baltic and Central European logs: 15 % of Swedish, 12 % of Danish, 11 % of Lithuanian entries, against 0.6 % of Spanish ones.
% of all entries naming quark, curd, skyr or cottage cheese. Each exact food name counts at most 30 times per language. Swedish and Danish logs are small samples (a handful of people).
When strawberries arrive
The month strawberries peak in food logs moves north with the season: March in Hebrew and Spanish logs, May in Hungarian, Romanian and Bulgarian, June further north and east, July–August in Finnish (rank correlation with latitude 0.87).
Language
Jan
Feb
Mar
Apr
May
Jun
Jul
Aug
Sep
Oct
Hebrew
1.6
1.9
2.0
1.3
0.8
0.7
0.4
0.6
0.6
0.5
Spanish
0.6
1.1
1.8
1.6
1.0
0.5
0.2
1.7
1.1
0.6
Bulgarian
0.6
0.6
1.0
0.8
2.6
1.3
0.3
0.2
0.0
0.0
Romanian
0.0
0.3
0.3
0.5
2.3
1.1
0.4
0.4
0.2
0.0
Hungarian
0.1
0.2
0.4
0.8
1.4
0.4
0.2
0.6
0.4
0.2
Slovak
0.6
0.2
0.5
0.7
0.9
1.3
0.4
0.5
0.5
0.6
Czech
0.4
0.5
0.7
1.4
0.9
1.1
0.6
0.2
0.3
0.2
Ukrainian
0.0
0.2
0.3
0.5
1.1
1.6
0.2
0.1
0.0
0.1
Polish
1.4
0.9
0.8
1.0
0.9
4.7
1.3
1.4
0.7
2.1
Lithuanian
1.0
0.5
1.2
0.8
1.6
3.1
2.8
1.5
1.0
1.4
Russian
0.1
0.4
0.5
0.4
1.0
1.5
0.4
0.3
0.2
0.3
Finnish
–
1.8
0.0
0.7
1.4
1.5
2.3
2.4
0.8
0.9
% of entries naming fresh strawberries (jam, yoghurt, ice cream and shakes excluded), by local month; each row shaded against its own peak; languages sorted by the latitude of the capital. Czech logs peak early (April), probably imported fruit.
Passover in Hebrew logs
During Pesach bread fell from 10.9 % to 6.4 % of Hebrew-language entries and matzah rose from 0.4 % to 5.9 %. In the three days after, bread jumped to 18.1 %, 66 % above its level before the holiday.
Period (2026)
Bread %
Leavened grain foods %
Matzah %
Entries
3 weeks before (11–31 Mar)
10.9
26.4
0.4
2,831
Pesach (2–9 Apr)
6.4
15.3
5.9
1,036
3 days after (10–12 Apr)
18.1
33.6
2.6
426
Rest of April
13.9
26.2
1.1
3,065
% of Hebrew-language entries. Leavened grain foods: bread, pita, challah, pasta, pizza, pastry, cake, cereals, couscous and similar.
Coffee for breakfast
Coffee is 22 % of Hungarian breakfast entries and 6 % of Czech ones, and the gap holds for photographed and typed entries alike. One likely reason: a milky, sweetened coffee has calories worth logging.
% of breakfast entries that include coffee.
All numbers
Language
Logs
Photos
kcal / meal
Protein %
Carbs %
Fat %
Weekend
Hungarian
169,370
44,093
338
23
40
38
+5 %
Russian
68,368
19,981
300
24
40
37
+2 %
Czech
44,665
17,999
356
22
40
38
+5 %
Hebrew
33,812
7,874
312
26
39
35
-3 %
English
33,247
12,195
339
23
42
35
+4 %
Ukrainian
28,793
9,941
320
25
38
37
+1 %
Slovak
28,565
8,646
344
24
41
36
+3 %
German
21,107
7,827
328
22
40
38
+0 %
Spanish
19,974
3,914
357
25
40
35
+2 %
Bulgarian
14,044
3,369
325
25
36
39
+5 %
Croatian
13,622
3,671
300
26
39
35
+2 %
Romanian
13,481
4,372
336
24
37
39
+7 %
Chinese
10,059
4,193
377
24
42
34
+4 %
Thai
10,032
3,592
327
27
40
33
+4 %
Finnish
10,031
4,366
360
23
40
37
+5 %
French
9,712
3,459
362
24
41
35
-2 %
Lithuanian
8,825
2,976
320
24
38
38
+1 %
Turkish
8,161
2,460
305
22
44
35
-6 %
Polish
7,773
2,482
332
22
42
36
+6 %
Swedish
5,878
1,464
356
26
38
36
+6 %
Portuguese
5,529
1,328
335
26
43
32
+0 %
Arabic
5,525
1,490
320
20
48
32
–
Danish
4,277
2,306
308
23
35
42
+1 %
Norwegian
2,889
1,168
388
24
39
37
-9 %
How we did it
Data: 620,836 food logs saved in the Kaloria app between 2026-01-15 and 2026-10-14 (179,686 of them photographed meals). The logs used here contain no names, accounts or photos; we count logs, not people.
Numbers: calories and nutrients are Kaloria's estimate for each logged food. They describe what people chose to log, not everything they ate.
Language, not nationality: each log is grouped by the language of the app. Czech, Hungarian, Hebrew or Japanese logs come mostly from one country; English, Spanish, Russian or Arabic logs come from many.
Language detection: typed entries record the app language; for photos we detected the language of the app's written analysis (it is written in the app language). On typed entries, where the language is known, the detector agreed 98 % of the time.
Privacy thresholds: a language is shown only with at least 1,000 photographed meals, a food name only if it was logged at least 40 times, and any other breakdown only with at least 200 logs behind it.
Meal times are the server's UTC time of each photo analysis, converted to the main time zone of the language (daylight saving included), only for languages spoken mainly in one zone. We checked the conversion at the March 2026 clock change: activity moved by about an hour in UTC and not at all in local time for Hungarian, Czech, Slovak, German, Ukrainian, Polish, Bulgarian and Swedish, and not at all for Turkish and Thai, which have no daylight saving. For Hebrew the check failed, so its times carry a †. The 95 % intervals come from resampling days, because the logs carry no user ids. The app pre-selects breakfast (04–10), lunch (11–14), dinner (17–21) or snack from the clock, and about a third of people keep that choice, which pulls the times slightly toward those windows.
Small languages: Norwegian, Swedish, Danish, Dutch, Greek, Italian and Slovenian have fewer than 25 entries a day, which is probably a handful of people on a typical day. Their rows carry a * and should be read as anecdotes, not national facts.
Foods are matched by keywords in each language. Each exact food name counts at most 30 times per language, so one very active person logging the same item every day cannot tip a result. Alcohol is left out for that reason.
Heavy users: logs are not weighted per person, so in the smaller languages a few very active people weigh more.
Weekends are Saturday and Sunday in local time, Friday and Saturday for Hebrew; Arabic is left out because weekends differ between Arabic-speaking countries.
Outliers: single logs under 5 kcal or over 3,000 kcal were left out.
Food and calendar stories (Easter, Passover, strawberries, quark, coffee) use keyword groups in each language. A group is shown only with at least 40 matching entries and every published cell rests on at least 200 entries; each exact food name counts at most 30 times per language. Each story was checked in both halves of the year (January–May and June–October).